KS - Statistics
The KS-Stats tool is a nonparemtric test to check the similarity between the distributions of two samples. In this cases, the two samples of data are based on combinations of one of the following categorical columns: Cell, FOV, or Treatment.
Menu Access: Analysis > KS-Statistics
Toolbar Icon: 
Running the Analysis
Go to the
Windowmenu and select one of the data tables. This will bring the selected table window to the front.
Start the KS-Stat tool by clicking on the icon in the toolbar or via the
Analysis>KS-Statmenu.In the
Configuration: KS-Statisticsdialog, define the desired categorical column for theComparisonparameter and thealphavalue.alphais the threshold for declaring the two entities dissimilar and will default to 0.05.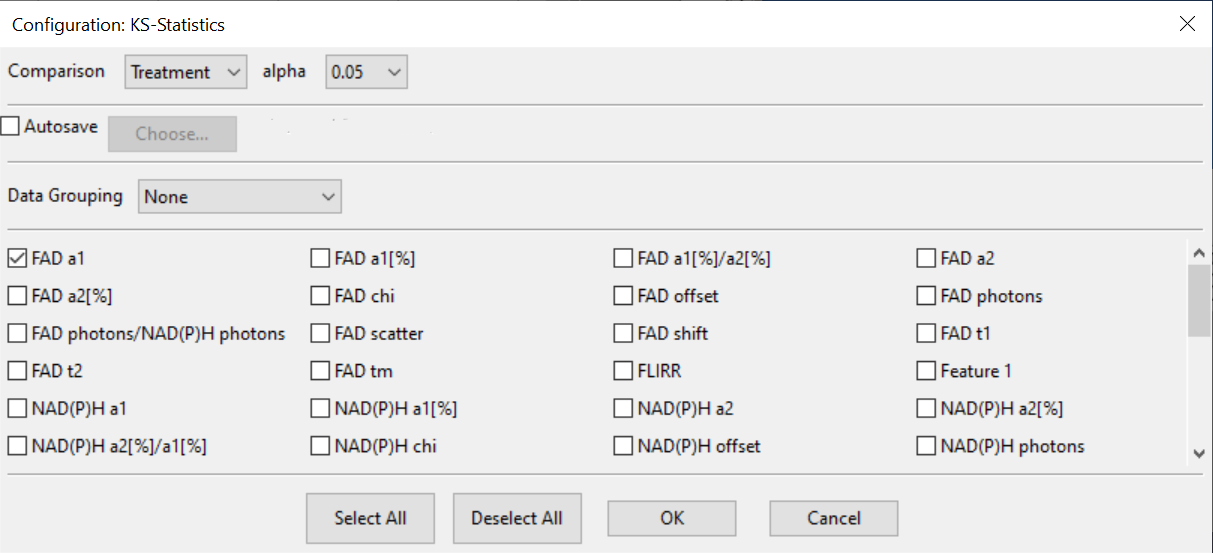
Select the data grouping and data features of interest. Data grouping options are based on the tables category columns, i.e.
Cell,Compartment,FOV, andTreatmentin this example. Data features correspond to columns with numeric data,FAD a1, etc..In the example, input data is not grouped, and only the FAD a1 data feature is selected.
Click
OK.The analysis results are shown in new data tables, one for each data feature selected. The new tables contain a declaration on if the two compared entities are dissimilar (yes or no), and n-values for each entity being compared, which are just the number of data points of that descriptor. More importantly, the tables displays p-values, statistic value, and critical D values, for each comparison. The p-value comes from the critical D statistic, and the critical D statistic is the max distance between the cumulative distributions of the compared items
Example Output
Example Results: Comparison - Treatment and Data Grouping - None

As shown above, based on the FAD a1 values, all of the treatments are dissimilar from one another. All of the p-values are 0, which is less the the alpha value of 0.05.