Random Forest Analysis
The Random Forest Analysis tool is a machine learning algorithm that deploys decision trees to arrive at data feature importance scores. These scores measure each feature’s impact on the predictive behavior of the model, with higher scores indicating a higher impact.
Menu Access: Analysis > Random Forest
Toolbar Icon: 
Running the Analysis
Go to the
Windowmenu and select one of the data tables. This will bring the selected table window to the front.
Start the
Random Forest Analysisby clicking on the icon in the toolbar or via theAnalysis>Random Forestmenu.In the
Configuration: Random Forest Analysisdialog, define the classifier, n-estimator, and test size.Classifier: One of the categorical columns. It defines what you want to “predict.” UsingTreatmentas a classifier, for example, will create a model that will determine which data features are most important in predicting a data point’s treatment.N-estimator: The number of trees used, which will default to 100.Test Size: The ratio of testing data to training data, which will default to 0.3. This means that the tool will use 30% test data and 70% training data.

Select the data grouping and data features of interest. Data grouping options are based on the tables category columns, i.e.
Cell,FOV, andTreatmentin this example. Data features correspond to columns with numeric data,FAD a1, etc..
In the example, input data is classified by Treatment, and uses the default values for both N-estimator and Test size.
Click
OK.The analysis results are shown in a new data table containing the importance scores for each of the selected data features, and also produces a histogram of this information, if the
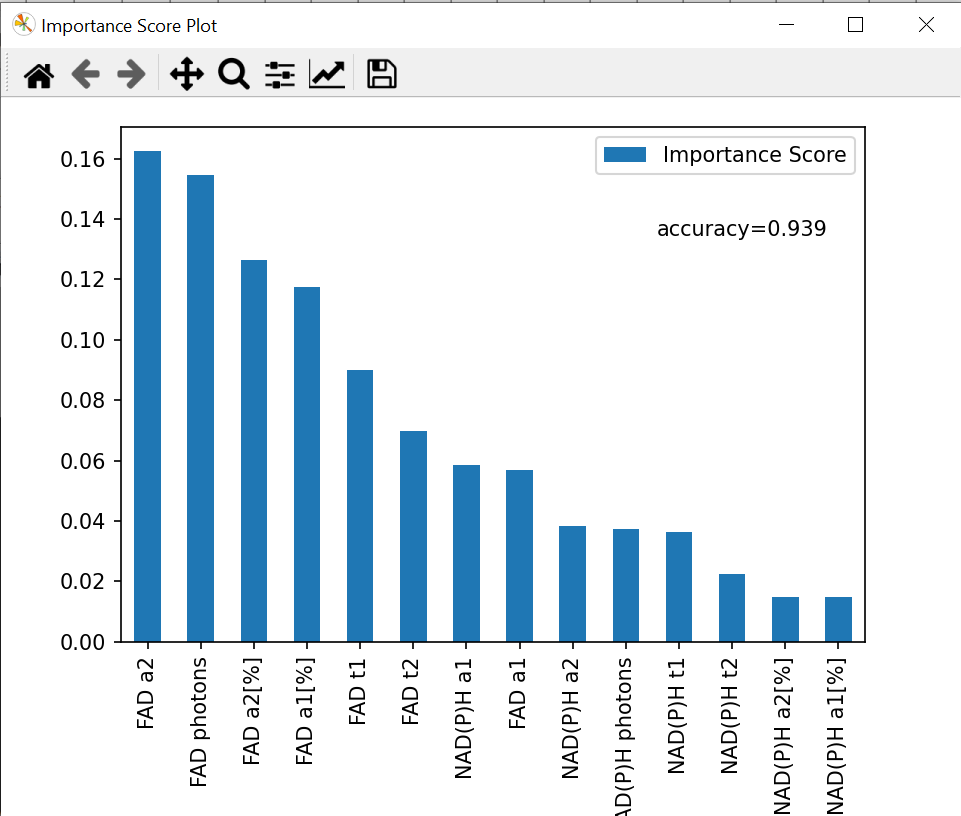
Importance Histogramcheckbox is checked off. As shown in the example importance histogram, an accuracy value is produced as well, with higher accuracy values being better.
Example Output
Example Results:
Importance Histogram using the configuration settings shown before:
New data table showing each data feature’s importance score:

In this example, FAD a1 had the highest importance score, meaning that it was more impactful in predicting the treatment of a particular cell. There is likely large variation in FAD a1 values across the various treatments.