Box Plot
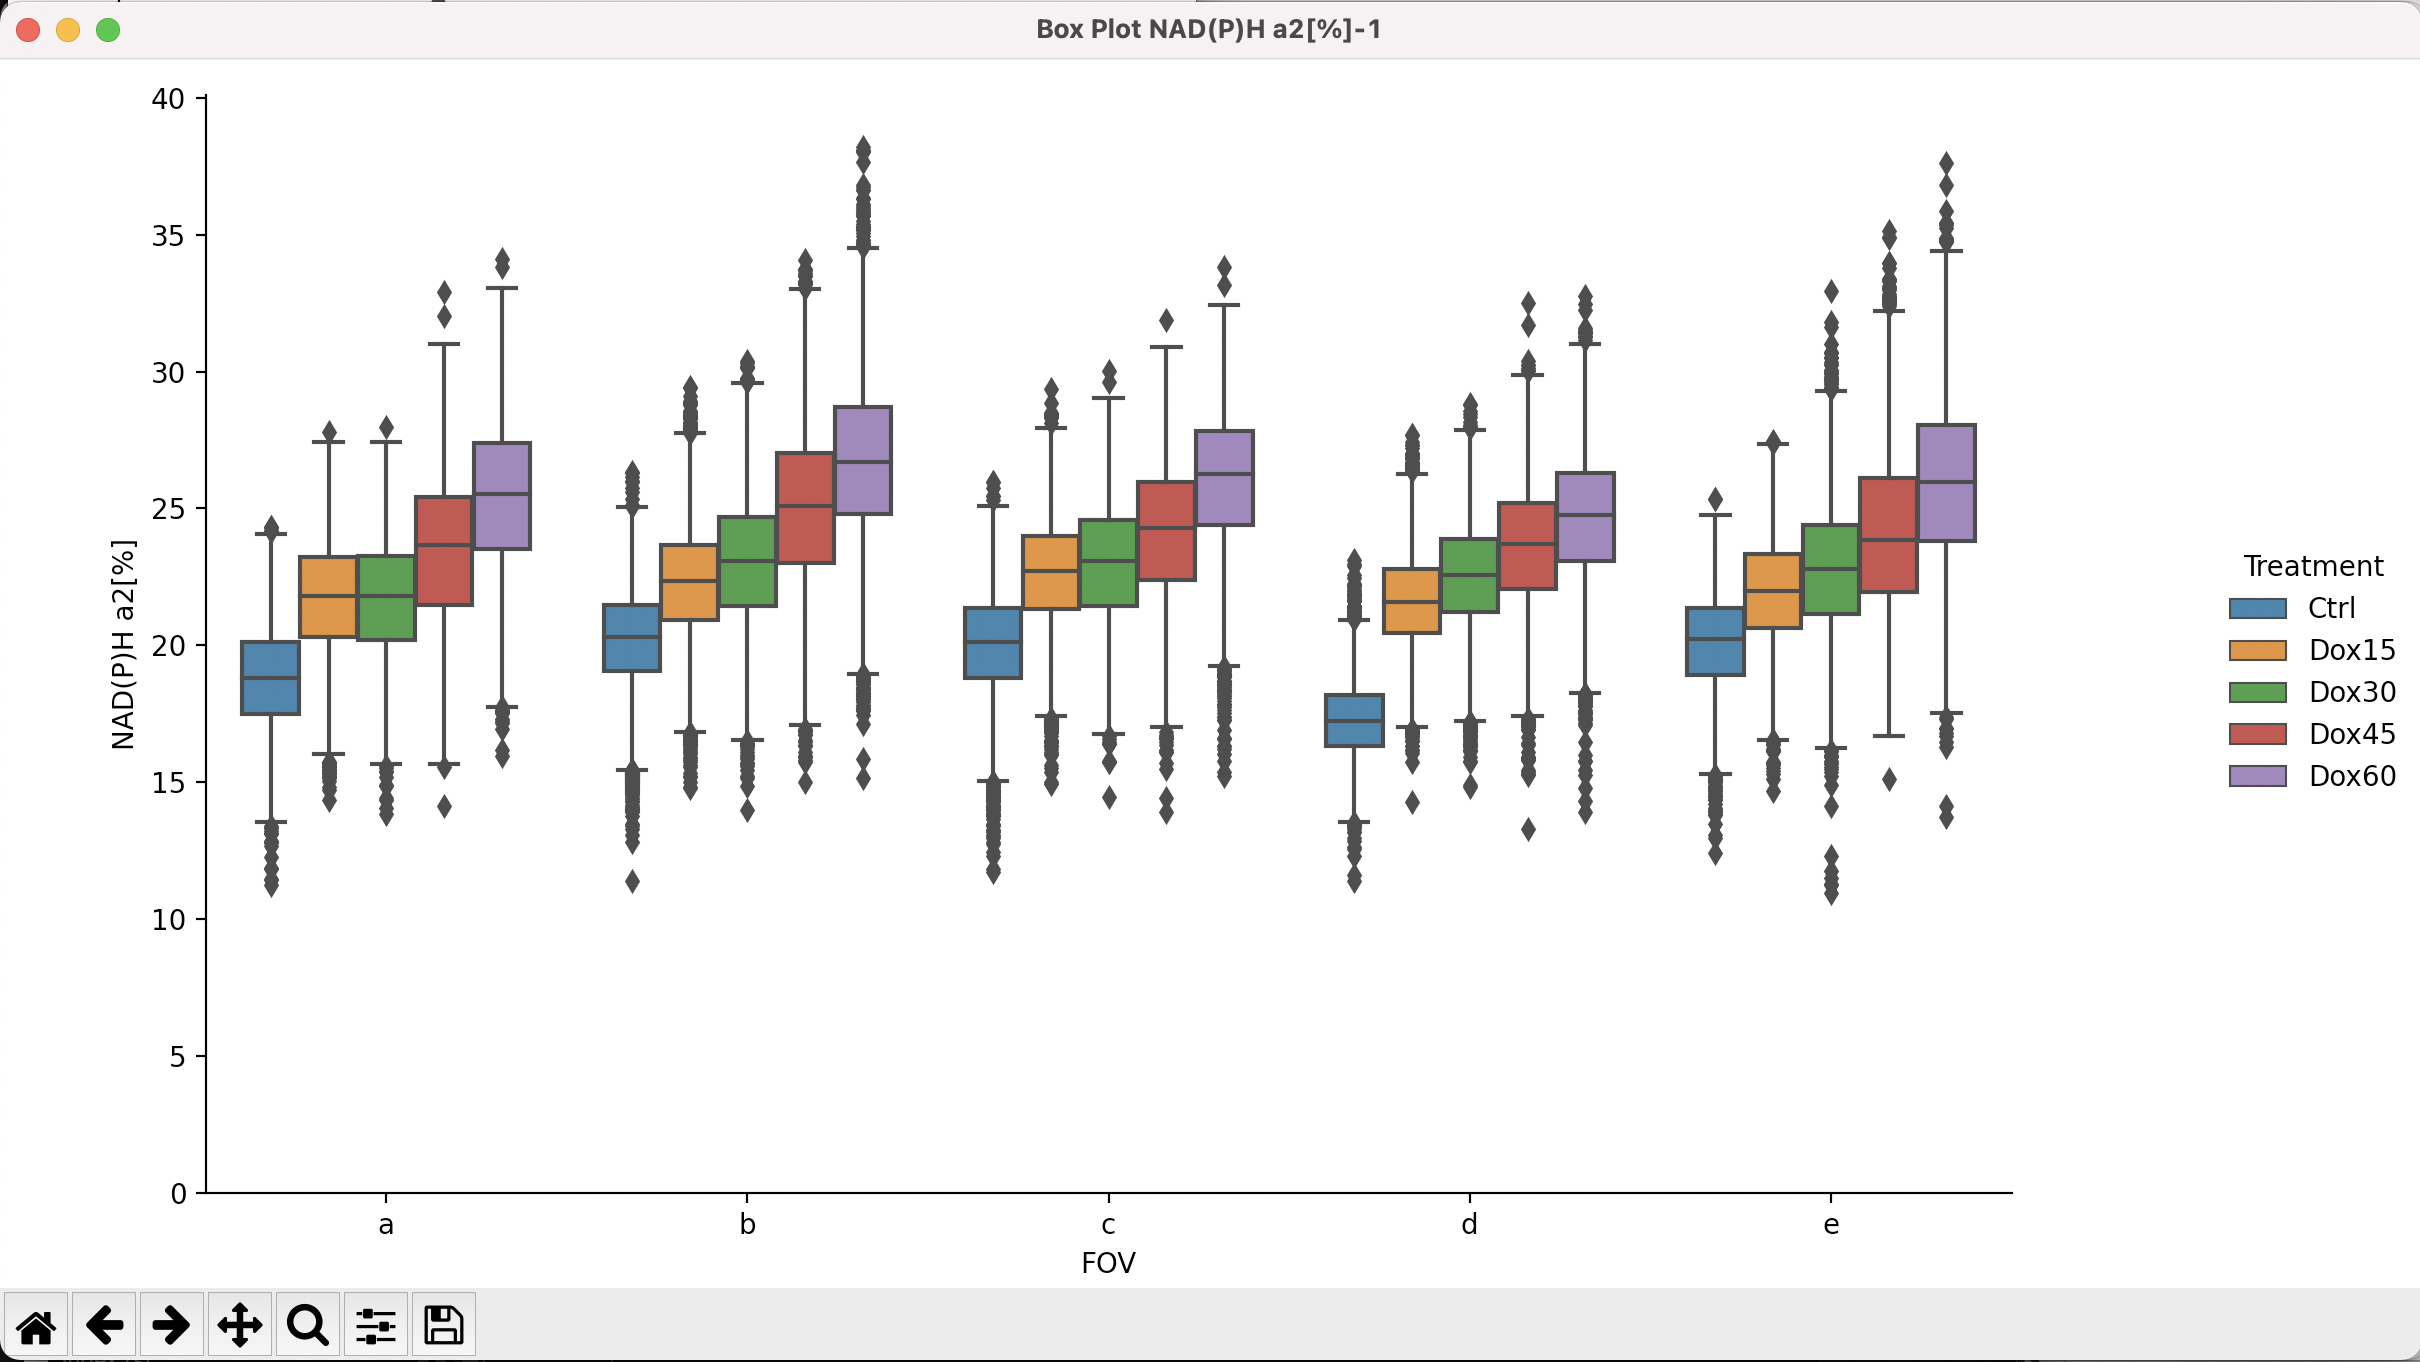
The Box Plot tool creates box plots based on mean +/- StDev (or S.E.M) of grouped data.
Menu Access: Plot > Boxplot
Toolbar Icon: 
Creating the Plot
Go to the
Windowmenu and select one of the data tables. This will bring the selected table window to the front.
Start the Box Plot tool by clicking on the icon in the toolbar or via the
Analysis>Box Plotmenu.In the
Configuration: Box Plotdialog, select the data grouping and data features of interest. Data grouping options are based on the tables category columns, i.e.Cell,Compartment,FOV, andTreatmentin this example. Data features correspond to columns with numeric data,FAD a1, etc..In the example, input data is grouped by
TreatmentandFOV.
Click
OK.The data for each analysis feature is plotted in its own plot window.
Note
The plot layout and grouping of bars can be changed by altering the order of the data grouping elements. See examples below.
Example Output
Example Results: Data Grouping - Treatment, FOV

Example Results: Data Grouping - FOV, Treatment
Note
Plots can be manipulated and saved as described in the Plots section.